
One of the most rewarding aspect of my job on Pelican of London is to sit down with a group of trainees, who just obtained a bunch of data from a scientific instrument, graph it, kick ideas around to make sense of it and place it into a bigger context.
It was Research Day during this year’s Plymouth Ocean Science Voyage aboard Pelican of London. One group of youngsters decided to investigate how temperature and salinity of the water change with time on a sunny day. We were anchored in a beautiful bay enclosed by the islands of Sark and Brecqhou.
It took the team a little while to decide on their experimental approach. Finally they agreed to deployed a CTD every half hour to measure salinity and temperature from surface to bottom. A CTD is an instrument that measures conductivity (from which salinity is calculated), temperature and pressure (from which depth is calculated).

This image shows our CTD at the beginning of a deployment hanging in surface waters next to the hull of Pelican of London. The instrument comprises of a battery pack (the cylinder on the right within the protective cage) and the central cylinder containing the sensors and memory card. In preparing the deployment, the team learned about water-tight connectors, sensor technology and weighing up data capture frequency against battery life and memory capacity.
The CTD is programmed and data gathering starts immediately until it is re-connected with the laptop. Data upload and processing is partially done by the user-friendly manufacturer’s (Daowan Technologies) software and partially in external data processing software of the user’s choice, by importing a .csv file.
This image was taken with a blueye Pioneer drone. (c) C Braungardt 2024
Set to take readings every 2 seconds, the instrument was lowered over the side of the ship and moved towards the sea floor by letting out more and more rope hand-over-hand. Shy of hitting the bottom, the maximum depth of deployment was 11 – 12 m, as determined with a 30 m measuring tape affixed to the cage. After six deployments, which each took around 10 minutes for lowering and retrieval, the data was uploaded and imported into MS Excel for further processing.
For the project team, there was a lot to discover. The data they had captured with the CTD provided a lot of information for learning, discussion and questions:
- How do we deal with a .csv file in Excel?
- What are the markers in the raw data that indicate the beginning and end of a deployment?
- How can we best visualise the data, and how does this work in Excel?
- Why did salinity remain constant with time and depth?
- What are the ‘busy wriggles’ at the beginning of the deployment in surface waters?
- Why do the earlier profiles show a more gradual change in temperature than the later profile?
- Why are the lines for down- and up-casts different from each other?
- What does it all mean in the greater scheme of things?
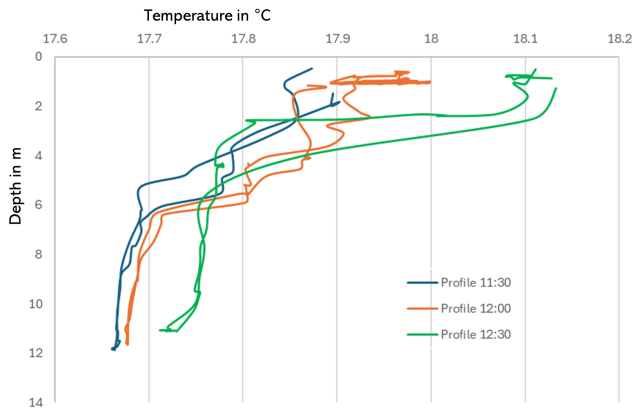
This graph shows the changes in the temperature profile in the bay over a period of one hour around midday. Each colour traces two lines that represent one down and one up profile during the same deployment.
The depth profiles are typical for a sunny day in a shallow bay in autumn: warmer surface waters that are less stable over time, compared to the cooler bottom waters.
The green profile shows a classic thermocline: a sharp temperature decrease from around 18.1oC in surface waters to between 17.7 and 17.8oC at depth. Although water masses are separated by the thermocline, warming at depth was evident from 12:30 onward.
For me, the data provided the opportunity to link what we saw in the bay to our discussions about the thermohaline circulation and the role of the oceans in climate regulation. At much smaller scale, the depth profiles captured here were indicative of the dynamic nature of marine systems, the influence of physical forces (e.g. currents, weather), the thermal capacity of water and how all of that is important for the marine ecosystem.
Hands-on data capture is invaluable for learning and I am grateful to Ocean College, who entrusted me with the use of the CTD on Pelican of London for STEAMS education voyages.
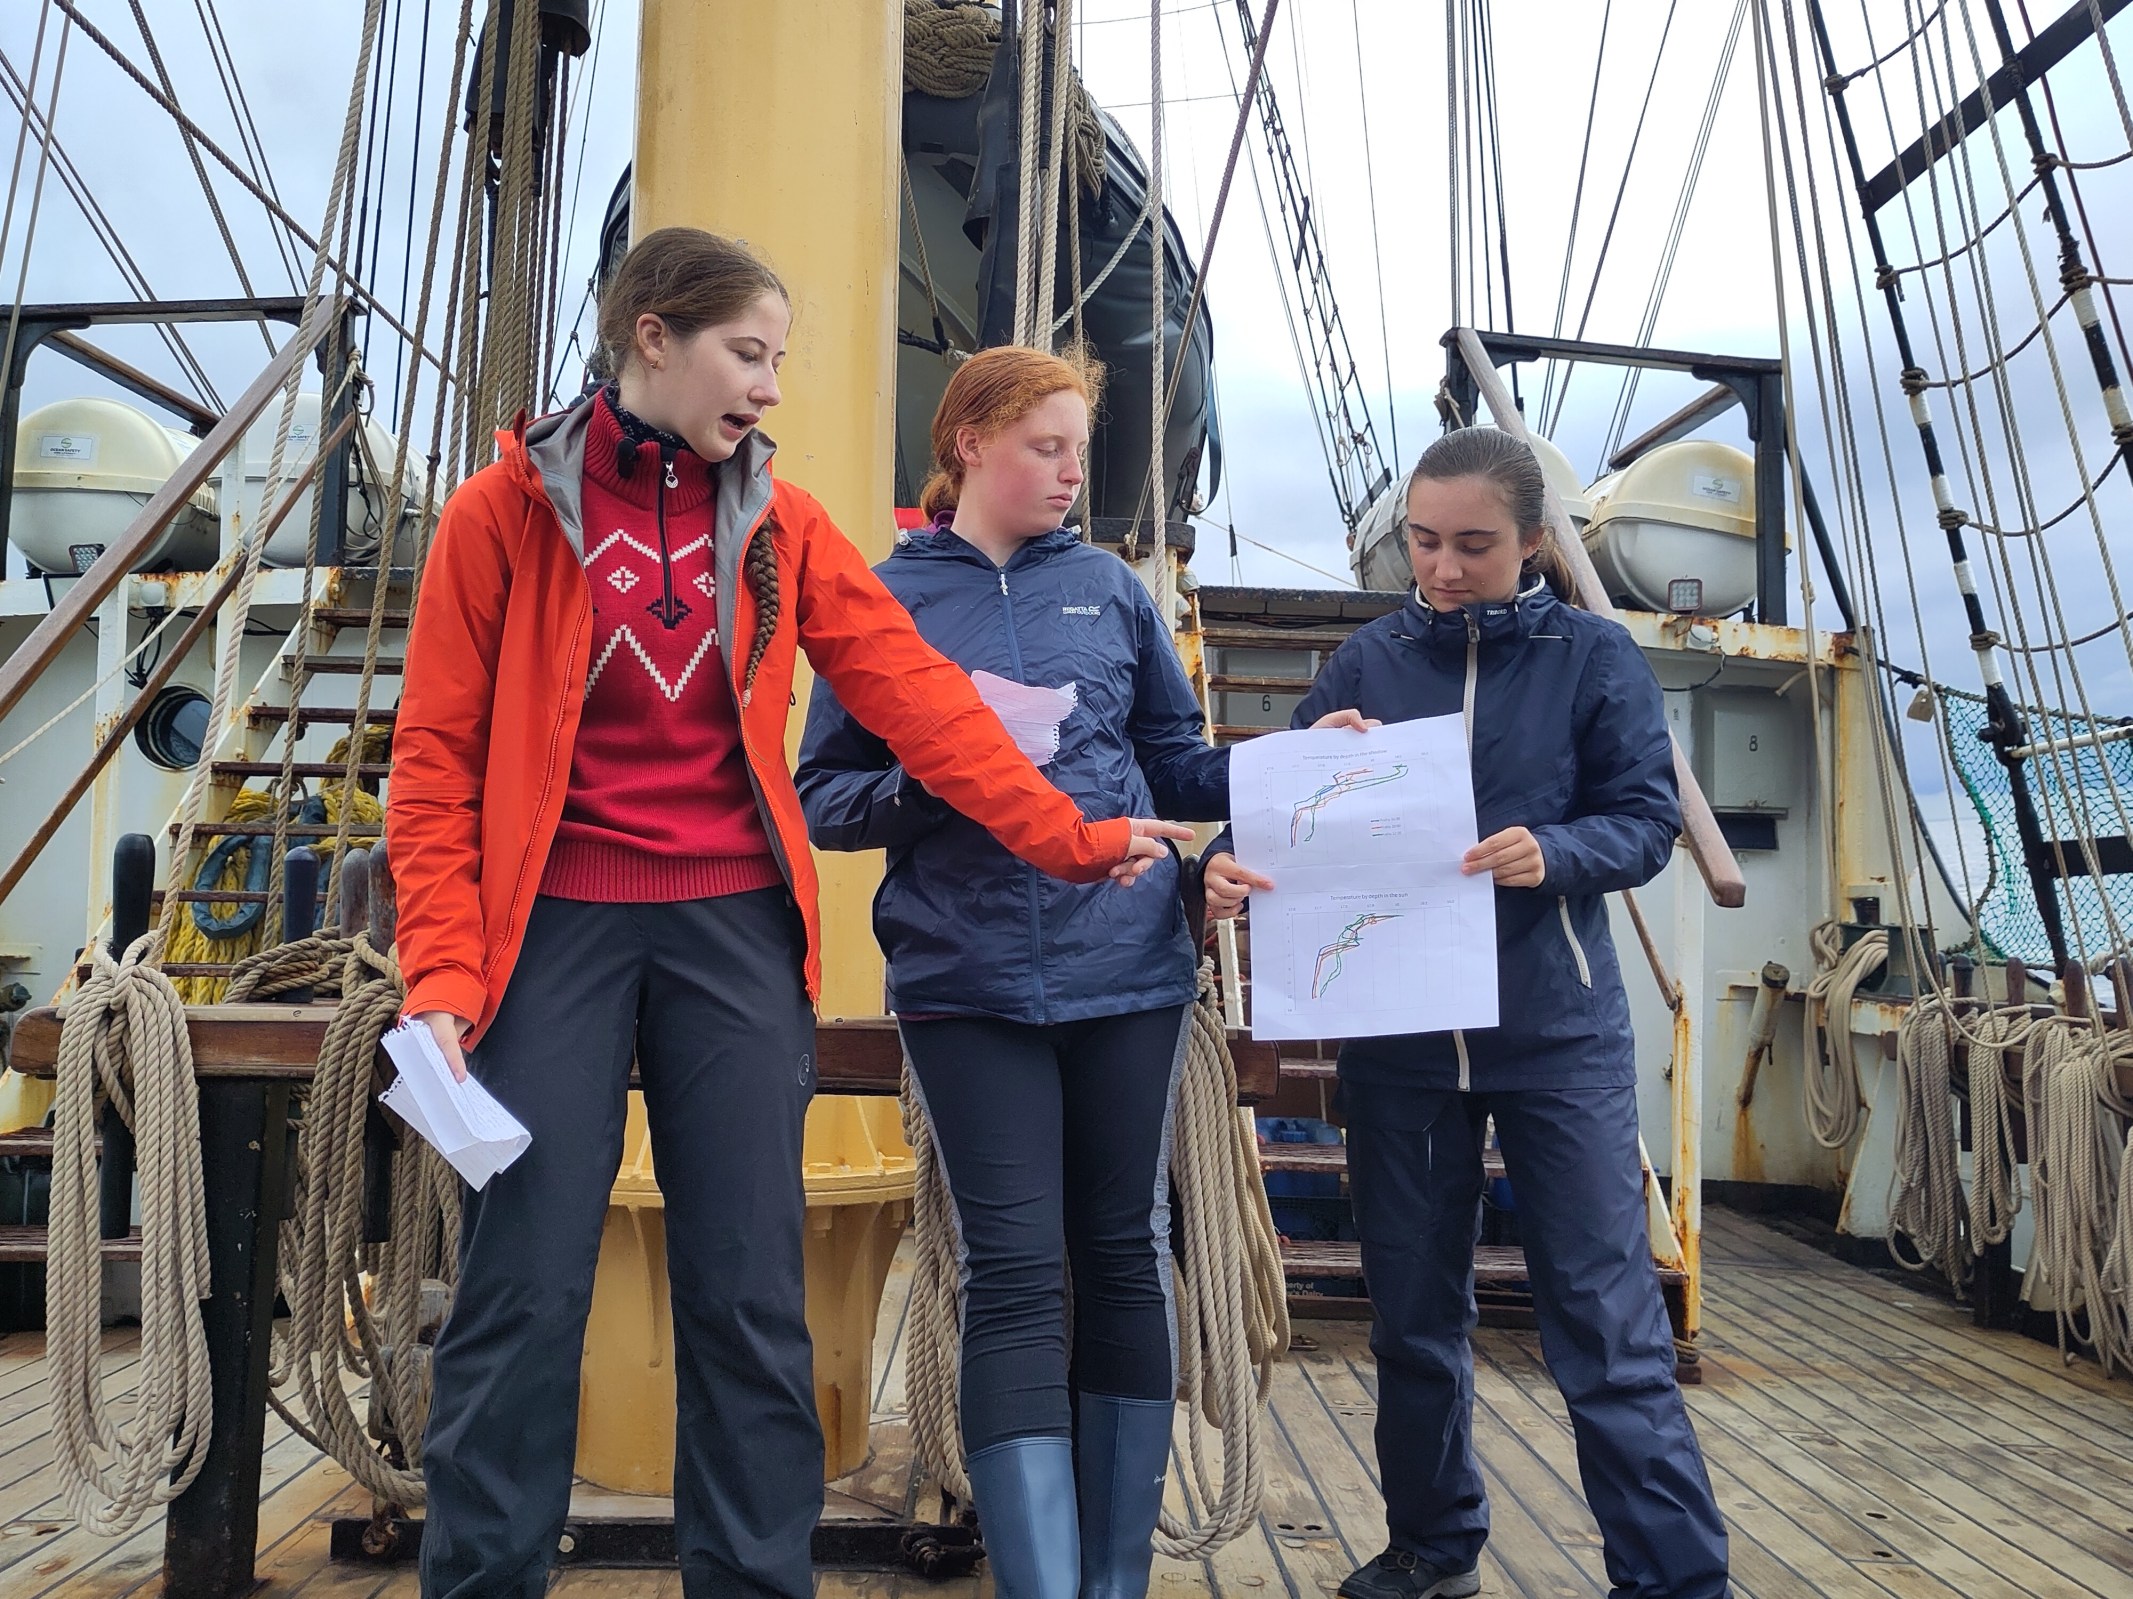
Featured Image: Members of the ‘Project Oceanography’ team explaining their results during the Plymouth Ocean Science Voyage in September 2024. (c) C Braungardt 2024.
