

When it comes to understanding what makes the ocean ‘tick’, plankton is the most important starting point.
The entire marine food web is built upon microscopic algae and other organisms that use photosynthesis to draw energy from sunlight and build cells from carbon dioxide. Like plants on land, these organisms are consumed by grazers, who in turn are consumed by predators, who are consumed by larger predators, and so on all the way to the top of the ocean food web.
We call it the food web because it is more complex than just a chain… This is illustrated in Figure 1, which shows a simplified representation of the food web that supports the herring. This is, of course, only a tiny part of the energy transfer between trophic levels in the ocean – numerous larger fish species, sea birds and marine mammals feed have herring as part of their diet.
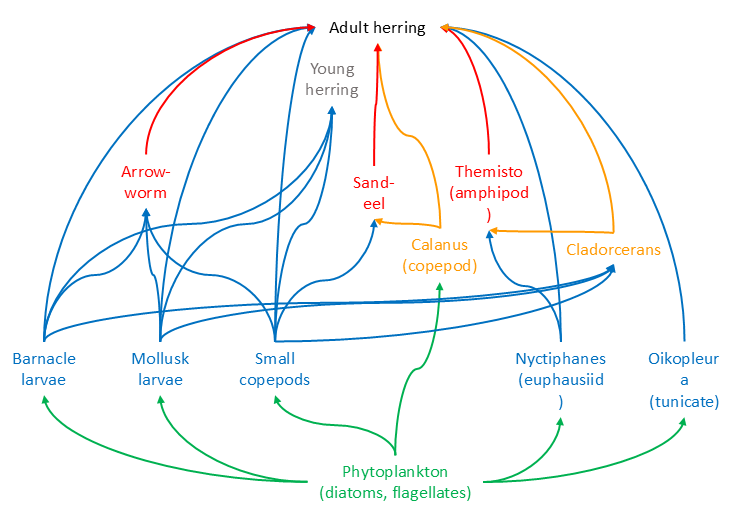
Figure 1. Food web that supports the herring, showing several trophic levels. (c) C Braungardt 2024.
Therefore, during the fifth Plymouth Ocean Science Voyage, the deployment of technology to explore marine biodiversity was swiftly followed by taking plankton samples.
Plankton identification at species level is tricky and requires a great deal of skill and experience. However, for a few years we’ve been using morphospecies to get a handle on biological diversity of plankton collected by trainees on the sail training tall ship Pelican of London.
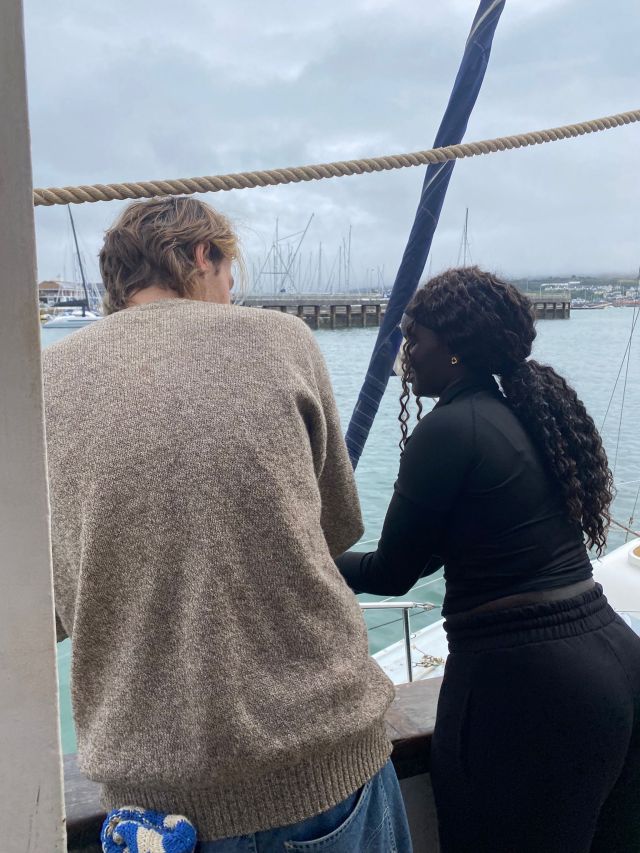
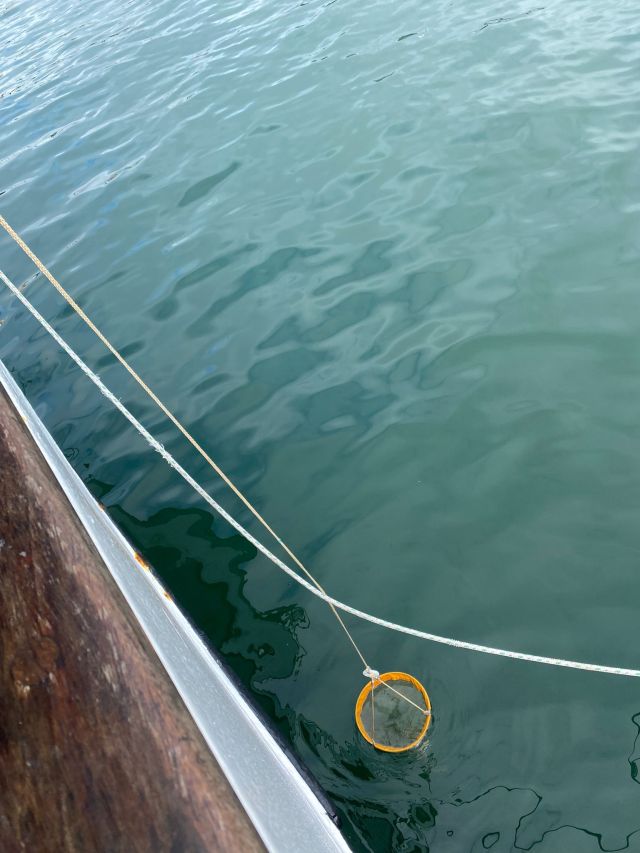
Figure 2. Marine conservation and oceanography student Caleb Frith and student Merlin take a plankton sample in Plymouth harbour.
Morphospecies identification is a simple technique where trainees count the number of differently looking plankton species under the microscope. As many zooplankton Morphospecies identification is a simple technique where trainees count the number of differently looking plankton species under the microscope. As many zooplankton (animals) have several differently looking juvenile stages, the total number of species may be overestimated. Equally, as many plankton species look similar, their number may be underestimated. It is a method with limitations, but when applied with consistency, it can provide useful data to show differences and similarities between locations.
For the young students, seeing what lives unseen in seawater was a revelation. After overcoming the initial awe, they got to work describing and drawing the phyto- and zooplankton species they saw.
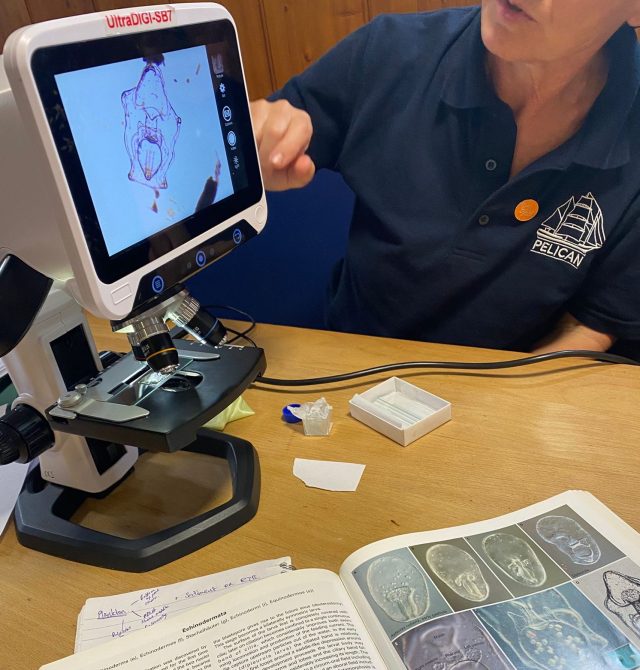
Figure 3. One of the larval stages of an echinoderm, to which sea urchins, cushion stars and starfish belong, under the microscope. Scientific literature helps with the identification at family level.
In the harbour, only 7 morphospecies were identified: curled and straight diatom chains, cushion diatoms, barnacle and copepod nauplii, bryozoan and polychaete worm larvae. The sample from Plymouth Sound had a higher diversity of phytoplankton (e.g. centric diatoms, dinoflagellates) and zooplankton (e.g. copepods, starfish larvae, molluscs), with 21 morphospecies counted in total.


Figure 4. Some of the morphospecies detected in the sample from Plymouth Sound. (c) C Braungardt 2026.
Biological statistics was another feature of our science education – knowing when you took enough samples to collect data that is representative of the whole population is a first step towards meaningful experimental design. But that’s a story for another time…suffice to say here that for this experiment we repeated until we found no new species.
The full interpretation of these results will be appearing on this blog when the eDNA analysis is completed later this year.
Featured image: dinoflagellate plankton from Plymouth Sound. (c) C Braungardt 2026.

