

I’ve just spent 10 days on Pelican of London and among other things, deployed my ROV among the Western Isles of Scotland. It’s been a challenge, to say the least, for my blueye Pioneer, as ‘slack water’ appears to be a concept that doesn’t exist in this part of the ocean. Let’s find out…
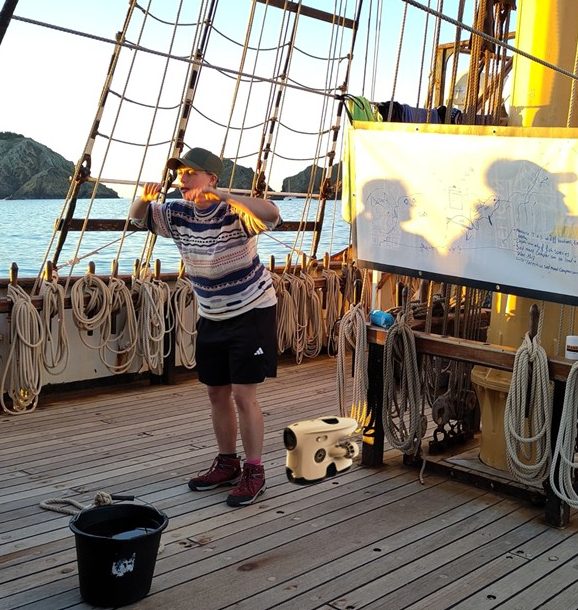
With 28 bright sixth-form students from North Liverpool Academy and one of its sister colleges on board, I was equipped with some gadgets to showcase marine science and technology:
- The above-mentioned remotely operated vehicle (ROV) by the Norwegian company blueye Robotics, with which I’ve explored various ecosystems in the past, including seagrass meadows, an enclosed dock and kelp forests. Finally, after 18 months in my possession, the ROV was named ‘Shelly’ as soon chief engineer Ramiz got sight of ‘her’.
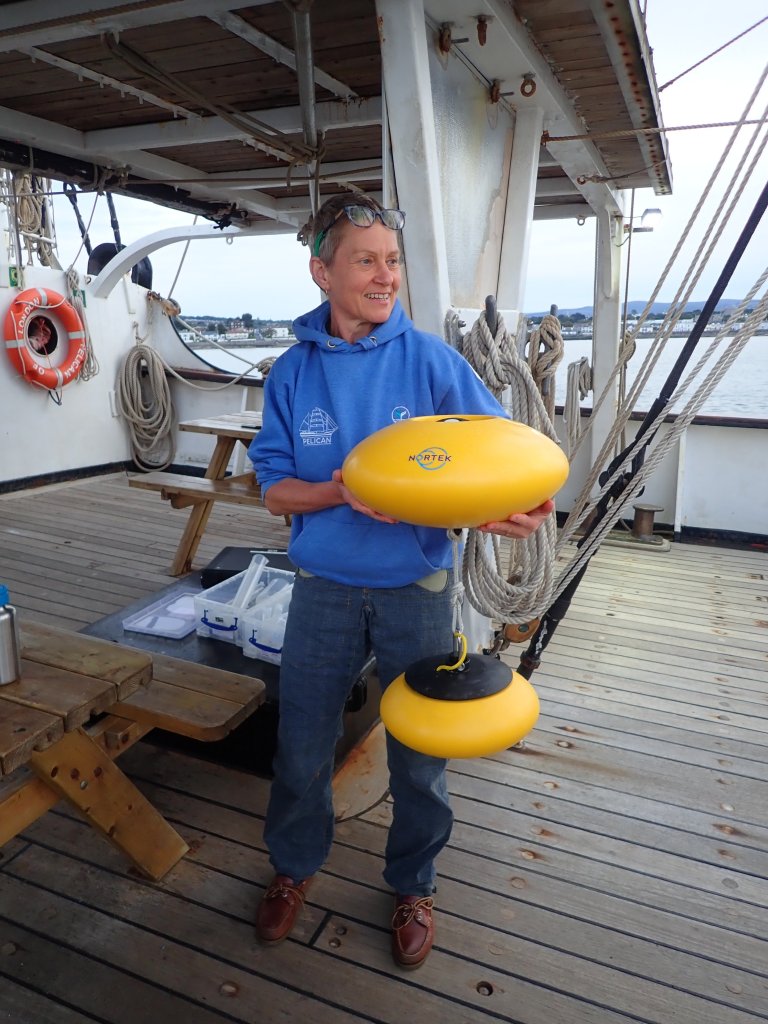
- An acoustic Doppler current profiler (ECO ADCP), kindly lent to us once more by Nortek Group, generally known on Pelican as ‘Bob’ since captain Roy named ‘him’ a couple of years ago in a previous case of anthropomorphism.
- A conductivity, temperature and depth profiler (CTD) (that remains without name because it tends to play up a bit, but it does have a nice cage).

We departed Liverpool Huskinsson Dock late at night and sailed up the Irish Sea, leaving the Isle of Man to starboard and passing the narrow Sound of Islay before heading north to anchor southwest off Staffa nearly two days and some 250 nautical miles later. A visit to Fingall’s cave had to be cancelled because rough seas prevented landing people safely ashore, so I decided to deploy Shelly for a view of the sea floor. She can dive to 150 m and I hoped that we may see some of the hexagonal rock formation and interesting marine life below the water.
Alas, both hopes were quickly dashed. Within the vicinity of our anchoring spot, the sea floor was largely covered in coarse sand and gravel, with occasional rocky outcrops similar to the red rocks we saw underlying the volcanic structures on Staffa’s cliffs. Although providing ample ground for macroalgae to get a hold and provide habitat for a highly diverse ecosystem, life was largely absent, bar a few starfish, sea urchins and hydroids. The presence of starfish fragments reminded me of the wreckage at the sea floor caused by bottom trawling shown in David Attenborough’s & National Geographic film Ocean. Lucky for me, two of the volunteer watch leaders on board are marine biologists, so that I could discuss with Emily Lee and Emily Murphy-Grey whether destructive fishing practice could be a potential reason for the dearth of life at this location. We did not come up with a likely alternative explanation. Nevertheless, abundant marine snow, the aggregated organic debris from small organisms and animal faeces, indicated a productive ecosystem in the water column above the sediment.
Shelly dealt well with around 1 knot of current, but it puzzled me that there should be current at all: we deployed at the time of high water, which should be ‘slack water’ with no current at all for a short while!
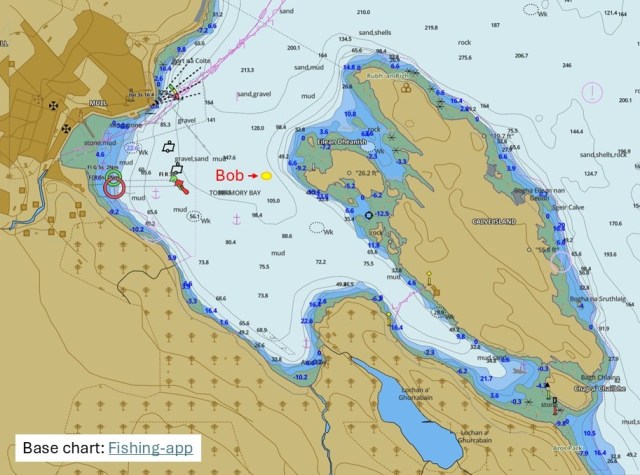
With strong winds forecast, we made way to the sheltered bay of Tobermory on the Isle of Mull. Bob was duly sunk to 37 meters to monitor water velocity and direction in the bay. Reliable as ever, Bob ‘bobbed’ back to surface at 08:30:33 the next morning and was retrieved with the help of the bosun’s team. We knew we had done some work after heaving the 30 kg anchoring weights off the sea floor to recover the release mechanism as well as the instrument itself.


Data output from Nortek Eco ADCP ‘Bob’ in two formats with velocity scales in m/s.
Upper graph: Timeline of the deployment from 20:00 on 26 June to 08:30 on 27 June 2025. The lower half of the graph shows the tilt (black line) of the sensor and pressure (red) above the instrument, as well as water temperature (green). The pressure relates to water height and indicates the time of high water around the beginning and end of the deployment, with low water around midnight. The upper half of the graph shows the currents at three different depths, whereby the scale of the velocity is given in colour (blue to red) and length of the vectors along the timeline, while the vectors point in the direction of water flow on the compass rose.
Lower graph: Detailed timeline of current velocity and direction in the upper layer. Scales as above.
It is the most chaotic (non-)pattern of currents I have seen from Bob, both in terms of direction and velocity. Compare this timeline to the undisturbed, symmetrical tidal flow at Aberystwyth and Blackpool Sands observed in 2023. Maximum velocities of 0.09 m/s were measured in the uppermost layer of the water column and the rapid changes of direction and velocity may relate to two disturbances:
(1) We noticed fishing and recreational vessels return to Tobermory from the north and their propellers could have caused turbulent flow at the deployment site. However, this was sporadic and did not continue throughout the night.
(2) Iain White (Nortek) proposed eddy formation during the ebbtide. Considering the complex bathymetry of the bay, with water flowing out of the bay in the north and flowing through a narrow channel in the southeast that dries at low water, the formation of eddies is a likely explanation. To understand why the floodtide was more ‘orderly’, more thorough investigations would be required in the region.
The stunning scenery of Loch Linnhe was covered quickly under full sail to reach Fort William. Hoping to explore the underwater world of this tidal Loch, we got Shelly to work at the hour of high water. Although waters looked reasonably calm, Shelly was simply swept upstream, against what I would have assumed to be a residual flow of fresh water pouring from the hills and Great Glen. The brief deployment video shows how fast the marine snow is swept past the camera, with Shelly being stationary at 16.5 m on the sediment. Our chief mate David is a licensed ROV pilot and helped expertly with the ROV recovery after we deciding that the mission would have to be abandoned.
On anchor between Oban and Kerrera, Bob was deployed once more. My idea for an underwater rendezvous of Shelly with Bob were dashed very quickly. I had just enough time and power for a quick look at the bottom before ‘rescuing’ Shelly from increasingly strong currents after winding strings of thongweed into the port-side forward thruster. Meeting Bob had become unthinkable…


Current profile taken with the Nortek ECO ADCP on 29 June 2025 off Kerrera in Oban Bay. Upper graph:, top to bottom: velocity scale in m/s, timeline of current velocity and direction at three depths, water temperature, pressure above sensor and tilt of sensor. Lower graph: velocity scale in m/s, detailed timeline of current velocity and direction in the upper layer.
According to the pressure above Bob, high water was around 21:30 with high water velocities mostly north-southerly directions. Six hours later, at low water, the current ran mainly south to north, again with maximum velocity. I deployed Shelly shortly after high water, making the assumption that currents would be minimal at that time based on my experience in more open tidal waters. I would have been better off doing it bleary eyed at 2 am, something that was not apparent from the tidal stream atlas available on the ship’s bridge.
Hindsight is a wonderful thing, but what is actually going on with the tides and currents in the Western Isles?
It all became clear when Dr Andrew Dale introduced us to the physical oceanography of the Western Isles during our visit at the Scottish Association for Marine Science (SAMS). He explained how differences in water levels between the open Atlantic to the north of Ireland and among the Western Isles differs, causing unusual tidal flows that can be intense, turbulent and with strong inclination to the formation of eddies in some areas. The tidal race and famous ‘whirlpool’ at the Gulf of Corryvreckan is only one, if extreme, example. How this plays out in detail at any given location has to be determined with a suitable measurement approach, involving more time and instrumentation deployment as was possible for us.
For the young students interested in robotics, physics and/or technology, our visit at SAMS complemented the deployment of Bob and Shelly from Pelican very well. And once more, the value of data at the required resolution has been made clear, as has the folly of assumptions.
Reference:
Armstrong C, Howe JA, Dale A, Allen C. 2021. Bathymetric observations of an extreme tidal flow: Approaches to the Gulf of Corryvreckan, western Scotland, UK. Continental Shelf Research 217, 104347. https://doi.org/10.1016/j.csr.2021.104347

Pingback: Voyage of Discovery | Challenging Habitat
Pingback: What lurks beneath the sea surface? | Challenging Habitat